
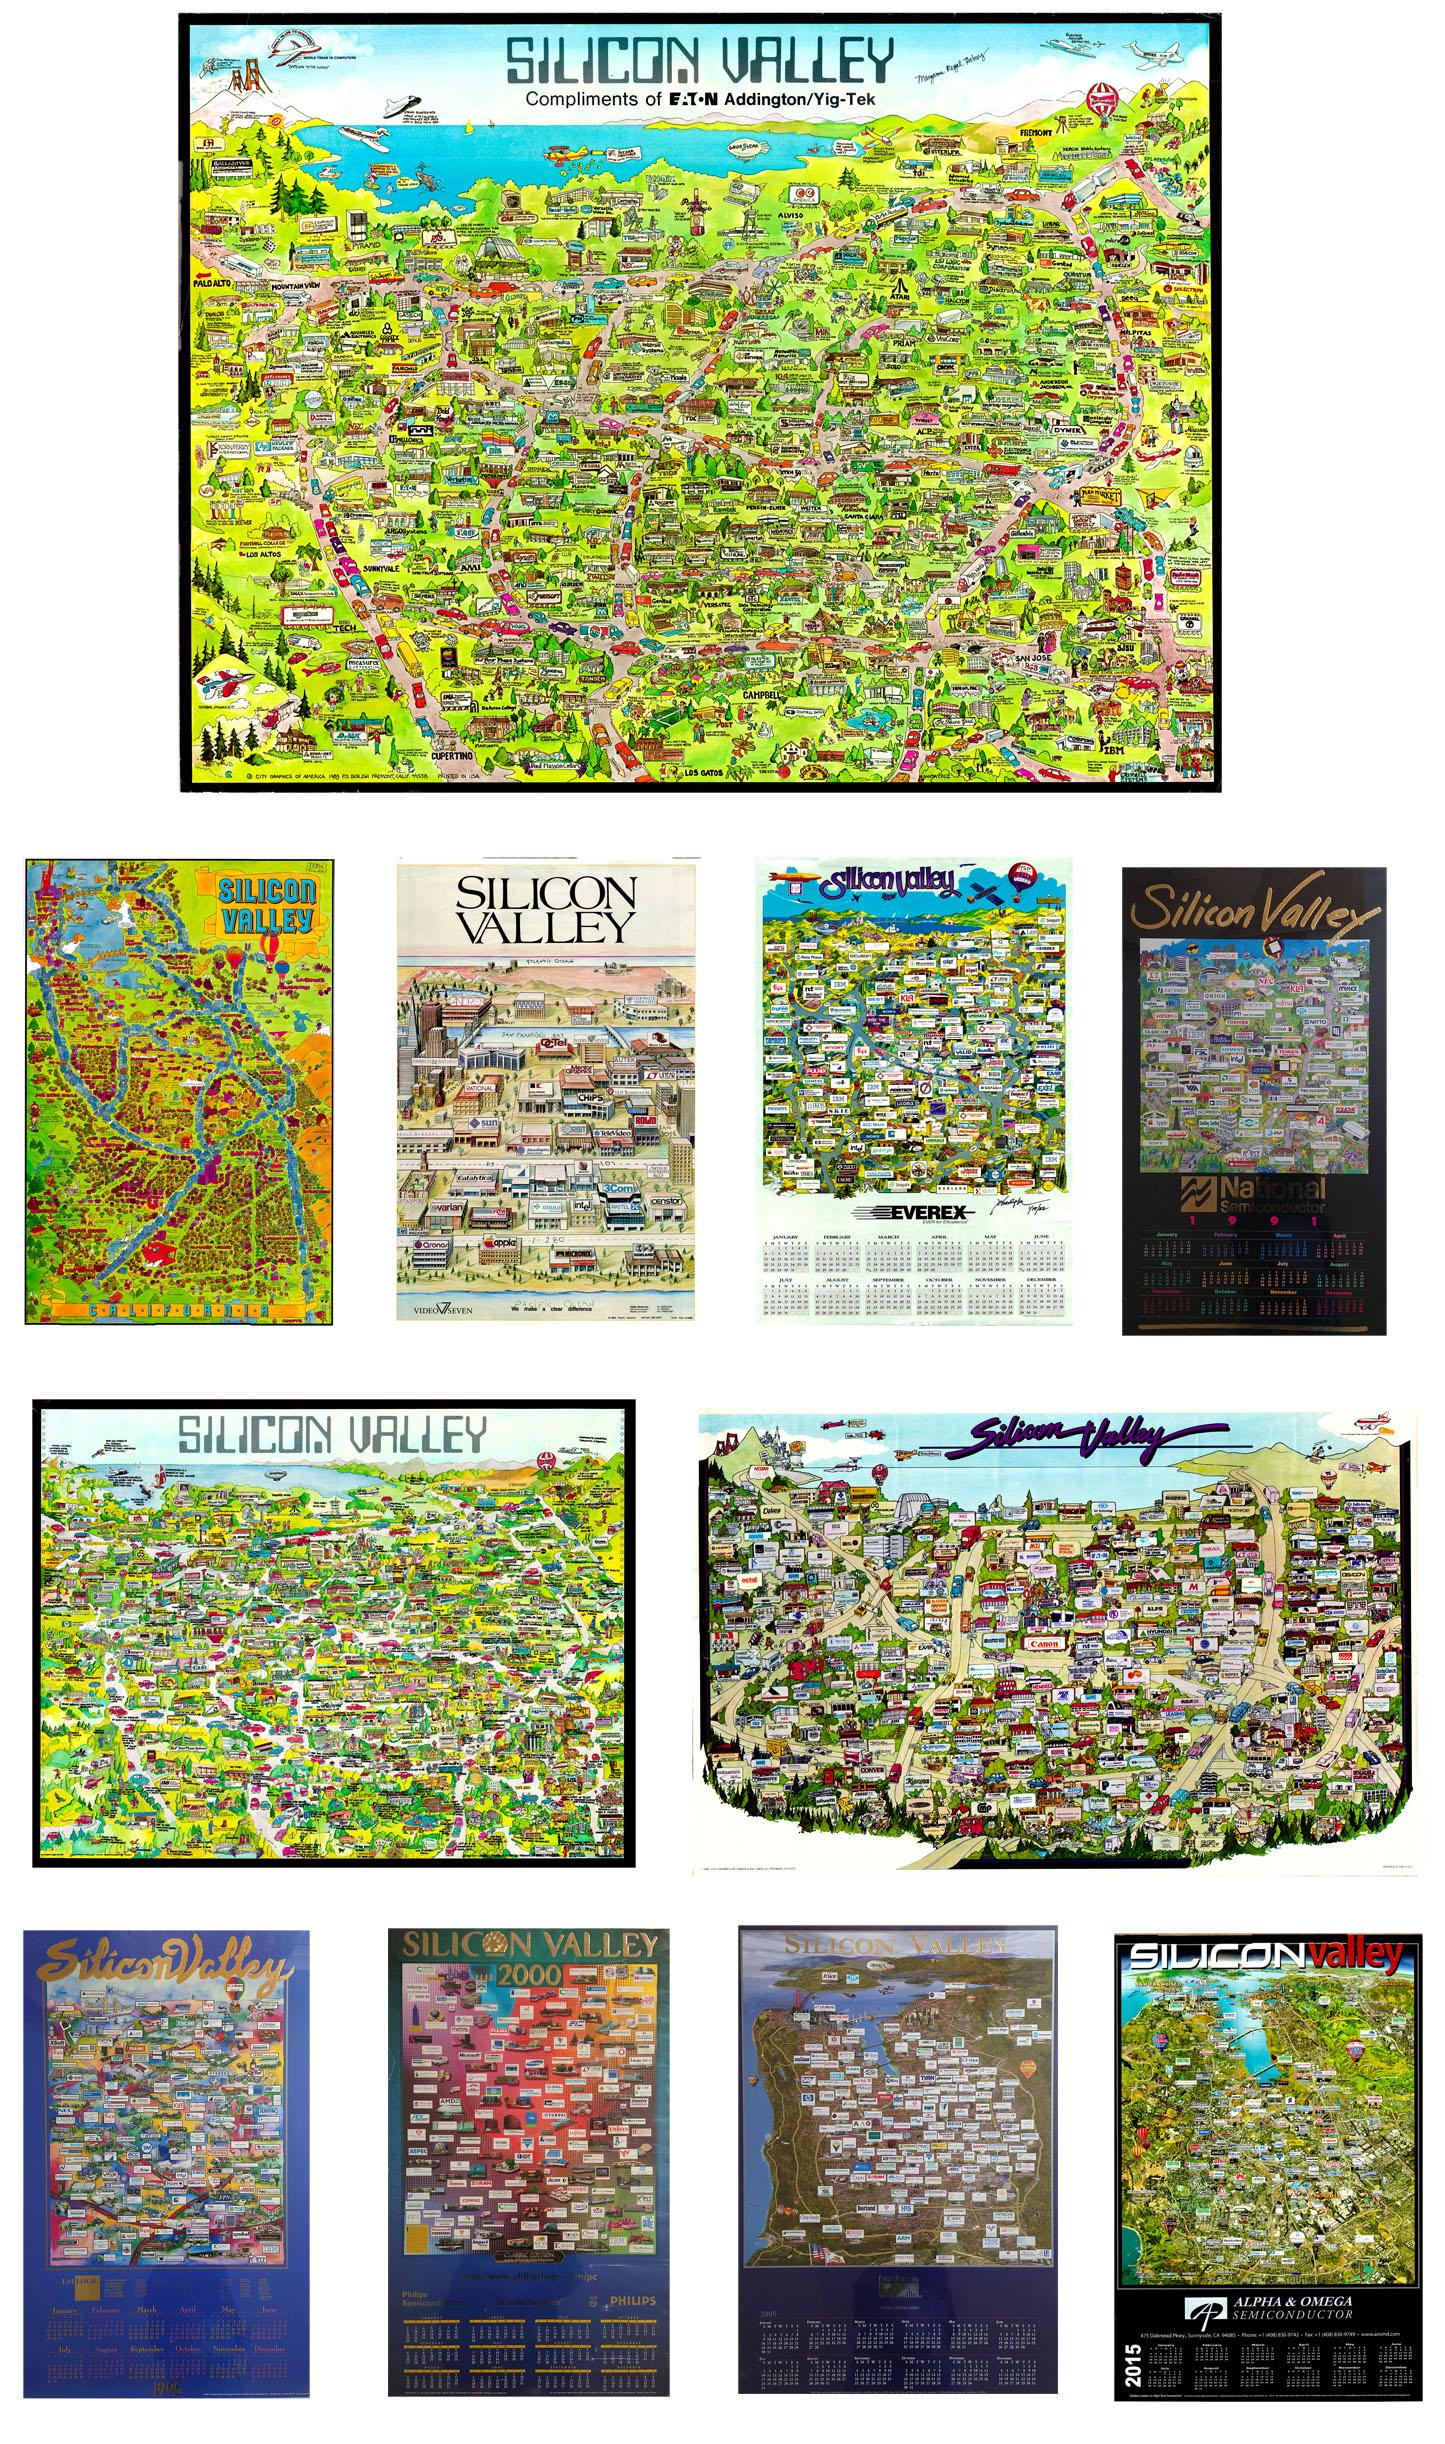
Coming soon, "Silicon Valley & Tech Regions".
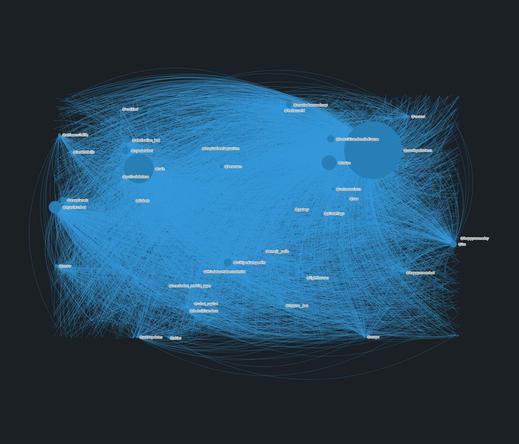
It's a topic we've found fascinating for years, not just in its mapping, but in the phenomena itself. We've heard Silicon Valley described as a example of "emergence" where components come together and in the right circumstances, at the right time, wild growth, interaction & change occur.


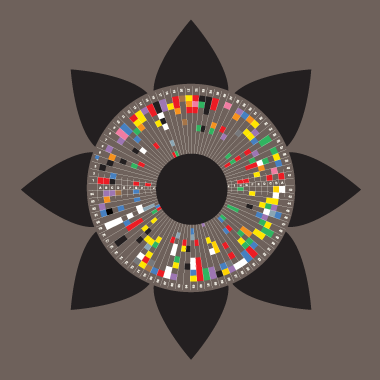
![Chart: Estimated U.S. Variant Proportions by Common Name
Sources: Centers for Disease Control, CoV-Lineages, NYITCOM Research, Daniele Focosi, World Health Network, others
[ beadsland on Ko-fi ]
Reskin of CDC's Variants Nowcast, and any significant variants in GISAID not broken out by CDC.
Five bar-style tree-charts, for fortnights through March 2–15. Legend of last fortnight, organized by subheadings of color-grouped families and convergent clusters. Percentages overlay each color key, reflecting share as of most recent tree-chart.
Essentially all WHO-Vaccine-Target JN.1. JN.1.11 accounts for over three fifths; JN.1.11 + FLiRT for near half.
For fortnight of 1/19–2/1, packed bubble charts fill single-variant tiles, indicating diversification of those variants (per GISAID) that wouldn't otherwise be apparent from CDC's Nowcast.
Legend:
LP.8.1 [purple]:
47% - LP.8.1.1 / NY† & other LP.8.1
JN.1 + FLiRT-KS [browns]:
26% - XEC.2†, XEC.8† & other XEC
2% - XEC.4
2% - XEQ
⅒% - other KS.1
JN.1.11 [greens]:
¾% - KP.3
15% - MC.10.1, MC.28.1, MC.19, MC.1 & other KP.3.1.1 / MC
JN.1 + FLiRT [reds]:
4% - LF.7
3% - LB.1.3.1 / NL
0% - LB.1
JN.1.11 + FLiRT [blues]:
½% - XEK
0% - KP.2.3 & KP.1.1.3 / LP
Other [greys]:
½% - JN.1.16
⅐% - other WHO-Vaccine-Target JN.1
⅒% - Other (not specified)
† Dagger variants are not broken out by CDC, yet represent a significant share of recent GISAID sequences.](https://spaces.hcommons.social/media_attachments/files/114/163/035/799/833/179/original/9a1523ae932eddff.jpg "Chart: Estimated U.S. Variant Proportions by Common Name
Sources: Centers for Disease Control, CoV-Lineages, NYITCOM Research, Daniele Focosi, World Health Network, others
[ beadsland on Ko-fi ]
Reskin of CDC's Variants Nowcast, and any significant variants in GISAID not broken out by CDC.
Five bar-style tree-charts, for fortnights through March 2–15. Legend of last fortnight, organized by subheadings of color-grouped families and convergent clusters. Percentages overlay each color key, reflecting share as of most recent tree-chart.
Essentially all WHO-Vaccine-Target JN.1. JN.1.11 accounts for over three fifths; JN.1.11 + FLiRT for near half.
For fortnight of 1/19–2/1, packed bubble charts fill single-variant tiles, indicating diversification of those variants (per GISAID) that wouldn't otherwise be apparent from CDC's Nowcast.
Legend:
LP.8.1 [purple]:
47% - LP.8.1.1 / NY† & other LP.8.1
JN.1 + FLiRT-KS [browns]:
26% - XEC.2†, XEC.8† & other XEC
2% - XEC.4
2% - XEQ
⅒% - other KS.1
JN.1.11 [greens]:
¾% - KP.3
15% - MC.10.1, MC.28.1, MC.19, MC.1 & other KP.3.1.1 / MC
JN.1 + FLiRT [reds]:
4% - LF.7
3% - LB.1.3.1 / NL
0% - LB.1
JN.1.11 + FLiRT [blues]:
½% - XEK
0% - KP.2.3 & KP.1.1.3 / LP
Other [greys]:
½% - JN.1.16
⅐% - other WHO-Vaccine-Target JN.1
⅒% - Other (not specified)
† Dagger variants are not broken out by CDC, yet represent a significant share of recent GISAID sequences.")


 - a community sourced


 Import data using PyDyTuesday
 Coloured subtitle text added with highlight_text
 Fonts installed with pyfonts by Joseph Barbier


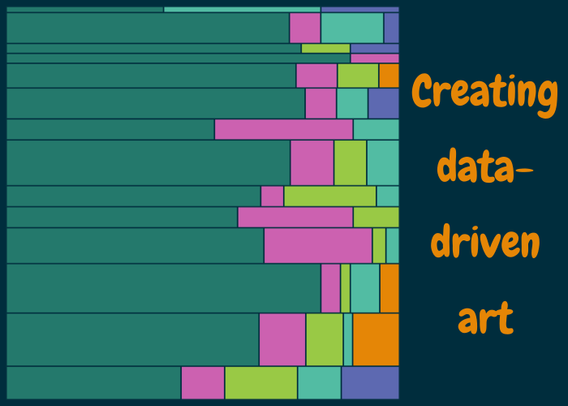
 New blog post about data art!
  Why do people make data art?
 It includes an example using